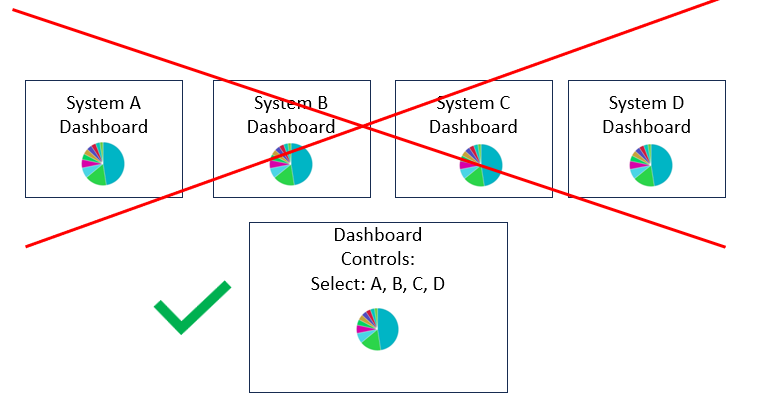
If you have the same dashboard content you want to display across multiple similar but different items, it can be extremely cumbersome to create separate dashboards for each item, etc. A very common technique is to build a single dashboard with the visualizations you desire, and then add controls to the dashboard that can change the visualization values in the dashboard depending upon the control filter selected. For example, you could have a dashboard for all windows logon failures, but if someone selects a control for a specific server the dashboard will dynamically change to display only logon failures for that server.

Select the Controls menu option and Add control as shown on the left diagram. Then you can add controls for specific fields as shown in the right diagram.

This is an example of using the dashboard controls for a specific research, or threat hunting or reporting use case. On the dashboard the Fortinet logs are limited to type utm which is unified threat management. Of the utm type logs the dashboard is further filtered to the subtype ips, and then on the left side of the diagram the different IPS attacks can be selected for investigation.

Because of the limitation in wildcarding field values in dashboard controls, another option to quickly changing dashboards to display a range of systems is by using markdowns. This is still more efficient than creating multiple dashboards for each site.

A little background on markdowns in dashboards.
Markdowns are most commonly used to add relevant key/instruction information to dashboards. In this example, the explanation of certain log code inference values in zeek ssh logs are shown in a markdown included with the dashboard so an analyst analyzing this type of log would not have to do a web search or consult a cheat sheet when analyzing the logs.

The image below shows the markdown panel opened in dashboard edit mode on right and the actual markdown text inserted for display.

If you wanted to add a markdown link that changed the dashboard to devices for a site you would do the following:
First, launch the generic dashboard.
Second, add the filter for the IP range for that site manually into the Kibana query window to change the dashboard and hence the url.

Third, copy the new URL with its relevant displayed hyperlink into the markdown window of the dashboard panel that has the markdown links for that dashboard. Viewable link text in brackets, it is followed by the url link that will be retrieved if someone selects that value. This url link is then the dashboard with the IP range for that site added as a filter. You can then add viewable delimiters such as pipes and the next hyperlink that could link to a different filter that will dynamically change the dashboard b just the user selecting the link.
Comments